9 Prometheus node 监控
# 安装 node_exporter
[root@promethues ~]# tar zxvf node_exporter-1.2.2.linux-amd64.tar.gz -C /usr/local/
node_exporter-1.2.2.linux-amd64/
node_exporter-1.2.2.linux-amd64/LICENSE
node_exporter-1.2.2.linux-amd64/NOTICE
node_exporter-1.2.2.linux-amd64/node_exporter
[root@promethues ~]# ln -sv /usr/local/node_exporter-1.2.2.linux-amd64 /usr/local/node_exporter
‘/usr/local/node_exporter’ -> ‘/usr/local/node_exporter-1.2.2.linux-amd64’
[root@promethues ~]#

# 编写启动文件
[root@promethues ~]# cat /usr/lib/systemd/system/node_exporter.service
[Unit]
Description=Prometheus node_exporter

[Service]
User=nobody
ExecStart=/usr/local/node_exporter/node_exporter --log.level=error
ExecStop=/usr/bin/killall node_exporter

[Install]
WantedBy=default.target

# 启动服务并设置开机自启
[root@promethues ~]# systemctl enable --now node_exporter
Created symlink from /etc/systemd/system/default.target.wants/node_exporter.service to /usr/lib/systemd/system/node_exporter.service.

# 验证 node_exporter 状态
[root@promethues ~]# systemctl status node_exporter
● node_exporter.service - Prometheus node_exporter
   Loaded: loaded (/usr/lib/systemd/system/node_exporter.service; enabled; vendor preset: disabled)
   Active: active (running) since Sun 2021-10-31 16:08:25 CST; 5s ago
 Main PID: 2254 (node_exporter)
    Tasks: 3
   Memory: 8.4M
   CGroup: /system.slice/node_exporter.service
           └─2254 /usr/local/node_exporter/node_exporter --log.level=error

Oct 31 16:08:25 promethues systemd[1]: Started Prometheus node_exporter.
[root@promethues ~]#
[root@promethues ~]# ps -ef|grep node_exporter
nobody    2254     1  0 16:08 ?        00:00:00 /usr/local/node_exporter/node_exporter --log.level=error
root      2259  2013  0 16:10 pts/2    00:00:00 grep --color=auto node_exporter
[root@promethues ~]#
将主机加入监控项
[root@promethues ~]# cat /usr/local/prometheus/prometheus.yml
# my global config
global:
  scrape_interval: 15s # Set the scrape interval to every 15 seconds. Default is every 1 minute.
  evaluation_interval: 15s # Evaluate rules every 15 seconds. The default is every 1 minute.
  # scrape_timeout is set to the global default (10s).

# Alertmanager configuration
alerting:
  alertmanagers:
    - static_configs:
        - targets:
          # - alertmanager:9093

# Load rules once and periodically evaluate them according to the global 'evaluation_interval'.
rule_files:
  # - "first_rules.yml"
  # - "second_rules.yml"

# A scrape configuration containing exactly one endpoint to scrape:
# Here it's Prometheus itself.
scrape_configs:
  # The job name is added as a label `job=<job_name>` to any timeseries scraped from this config.
  - job_name: "prometheus"

    # metrics_path defaults to '/metrics'
    # scheme defaults to 'http'.

    static_configs:
      - targets: ["localhost:9090"]

  - job_name: "host_monitor"
    static_configs:
      - targets: ["localhost:9100"]   # 新增 9100 端口主机监控

# 检查语法
[root@promethues ~]# /usr/local/prometheus/promtool check config /usr/local/prometheus/prometheus.yml
Checking /usr/local/prometheus/prometheus.yml
  SUCCESS: 0 rule files found

[root@promethues ~]#
# 重启 Prometheus
[root@promethues ~]# systemctl restart prometheus
查看是否已经被监控

9.1 查询指定 mertic_name
node_cpu_seconds_total

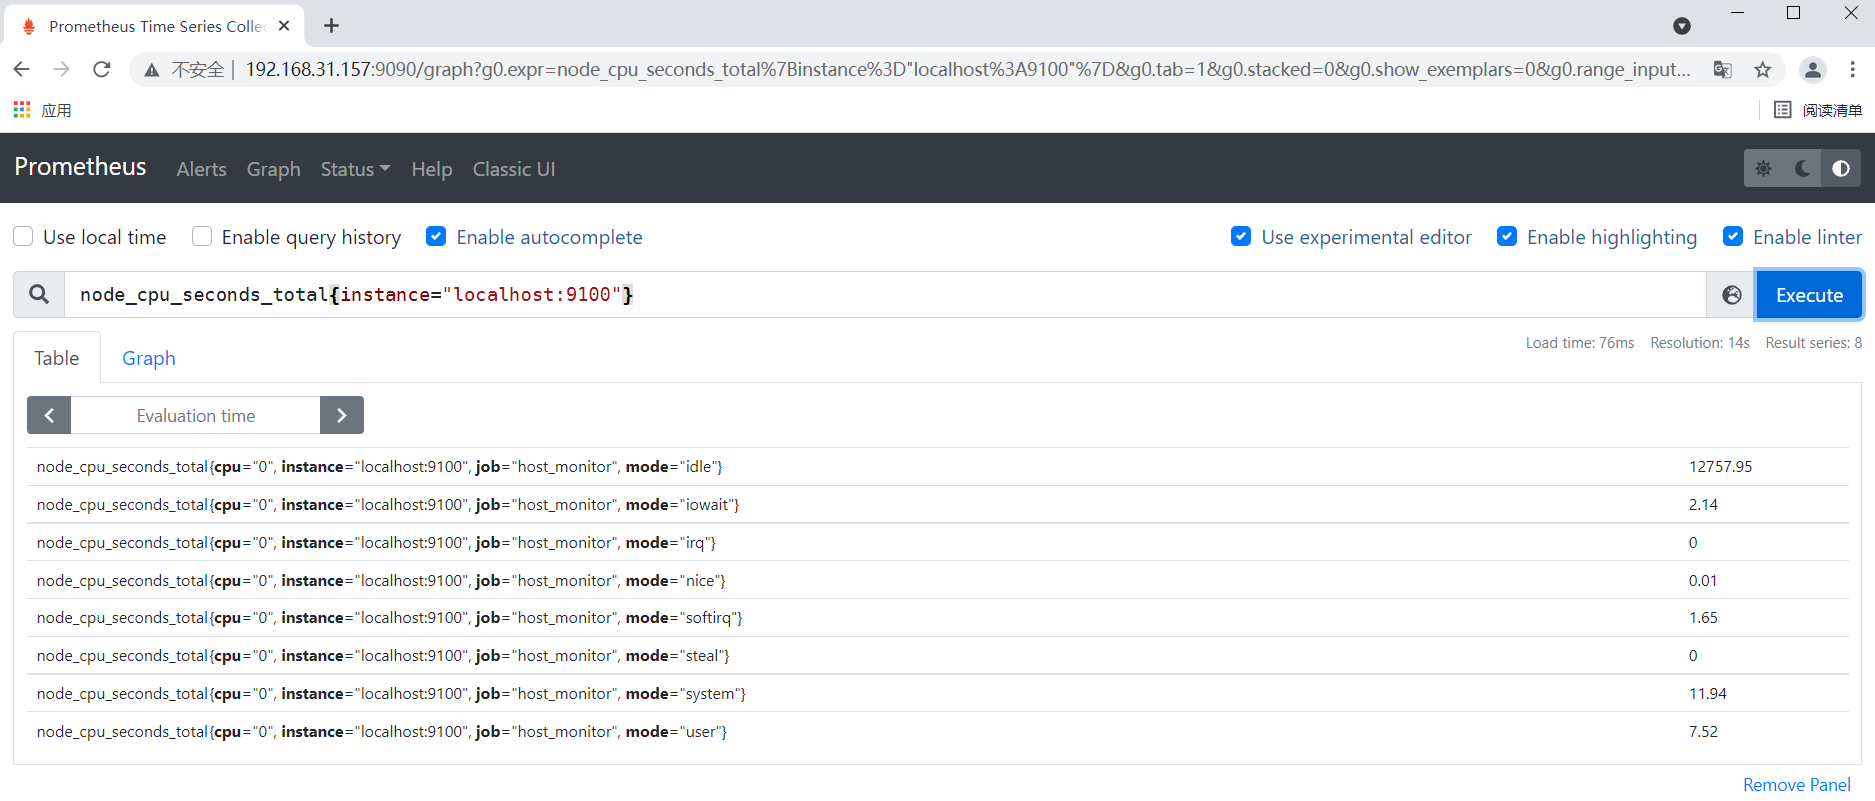
9.2 带标签的查询
node_cpu_seconds_total{instance="localhost:9100"}
9.3 多标签查询
node_cpu_seconds_total{instance="localhost:9100",mode="system"}

9.4 计算 CPU 使用率
100 - (avg(irate(node_cpu_seconds_total{mode="idle"}[5m])) by (instance) * 100)

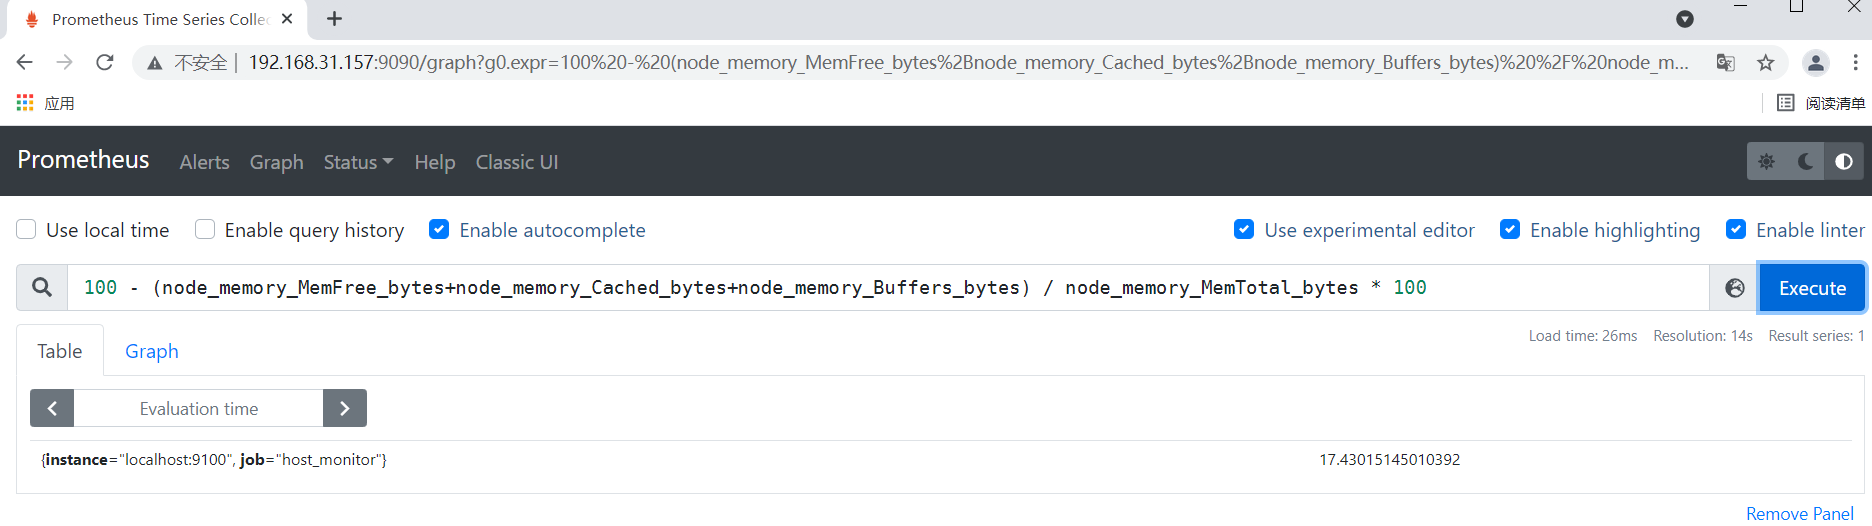
9.5 计算内存使用率
100 - (node_memory_MemFree_bytes+node_memory_Cached_bytes+node_memory_Buffers_bytes) / node_memory_MemTotal_bytes * 100
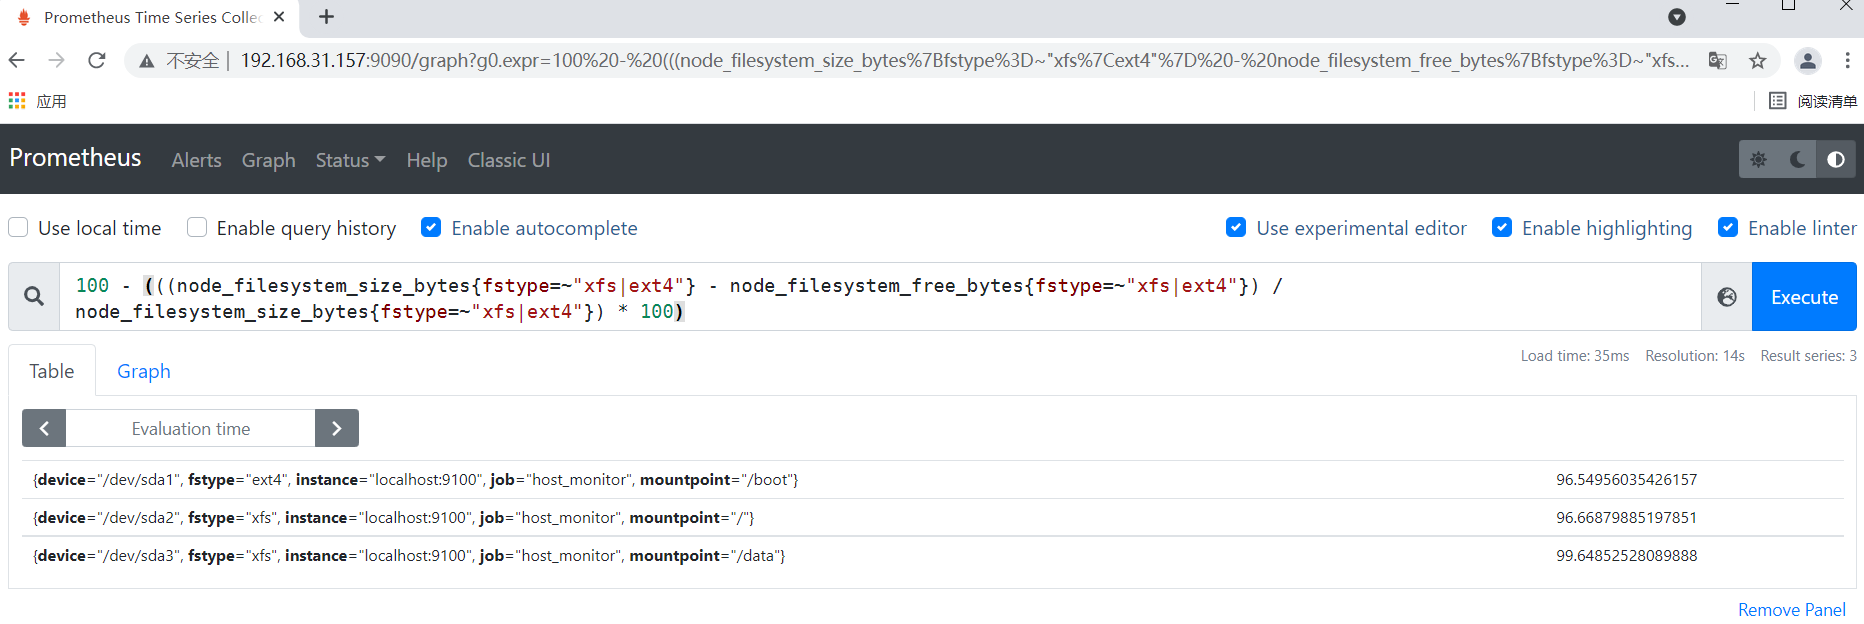
9.6 计算磁盘使用率
100 - (((node_filesystem_size_bytes{fstype=~"xfs|ext4"} - node_filesystem_free_bytes{fstype=~"xfs|ext4"}) / node_filesystem_size_bytes{fstype=~"xfs|ext4"}) * 100)